US ECONOMIC EXPANSION CONTINUES
Executive Summary
The Globicus Leading Economic Index signals sustained U.S. economic expansion into early 2026. Forward-looking indicators remain firmly positive, the yield curve has normalized, fiscal stimulus is forthcoming, and monetary policy remains accommodative relative to standard policy benchmarks.
Globicus Leading Economic Indexes: Recent Developments and Business Cycle Assessment
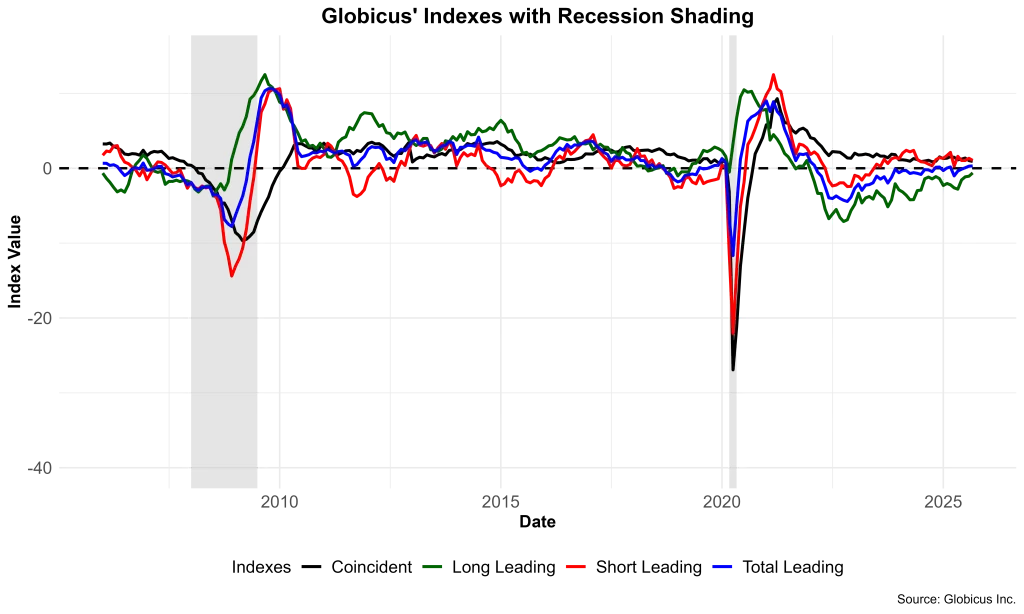
The Globicus suite of leading economic indexes—comprising the Total Leading Index, Long Leading Index, and Short Leading Index, is constructed to identify cyclical turning points and enhance the precision of forward-looking macroeconomic forecasts. These composite indicators serve as anticipatory measures of business cycle transitions and aggregate economic trajectory.
The most recent data releases and subsequent revisions indicate strengthening momentum across all leading indicators.[1] The Total Leading Index registered growth of 1.4 in December 2025, representing an acceleration from 1.3 in November. The Short Leading Index, which has maintained positive territory continuously since mid-2023, was 1.5 in December down from 1.9 in November. Concurrently, the Long Leading Index advanced strongly to 1.2 in December from 0.5 in November, marking its fourth consecutive positive reading.
Collectively, these composite measures show positive momentum, signaling continued economic expansion for the United States economy through at least the first part of 2026.
The Globicus Coincident Index (GCI), which synthesizes contemporaneous macroeconomic data, rose to 0.8 in December 2025, an increase from the multi-year nadir of 0.4 observed in October. This uptick suggests a potential inflection point in the current growth trajectory, indicating a reversal from recent deceleration.
The Yield Curve Has Turned Positive
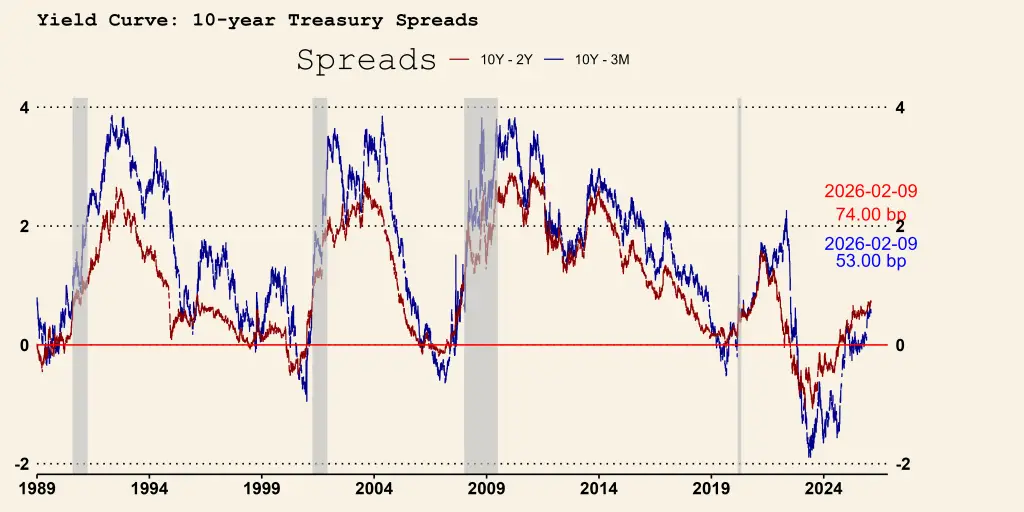
The yield spread between the ten-year and three-month Treasury securities, a historically robust recession predictor, turned positive on December 13, 2024, thus ending the longest recorded inversion. Historically, an inverted yield curve has preceded recessions, and in recent cycles, the curve typically turned positive shortly before the onset of recession, as the Federal Reserve began to lower the federal funds rate. The spread hovered near zero for a while but has risen to over fifty basis points in early 2026, because of easier monetary conditions, AI optimism: strong capex investment and productivity gains. Fiscal stimulus may also support the expansion in 2026. Tax incentives; tax refunds, lower tax on overtime and tips, and accelerated depreciation. In addition, regulatory reforms will support growth, The CBO estimates that the One Big Beautiful Bill, (OBBBA) will boost US growth by 0.9%.
Federal Reserve Monetary Policy Decision
At its January 27–28, 2026, meeting, the Federal Open Market Committee (FOMC) maintained the federal funds rate target range at 3.50%–3.75%, noting that economic activity “has been expanding at a solid pace.” Governors Stephen Miran and Christopher Waller dissented, favoring a 25-basis-point reduction. The pause ended a sequence of three consecutive 25-bp cuts, which had been framed by the Fed as insurance measures amid a weakening employment situation.
At the press conference, Chairman Jerome Powell emphasized that the balance of risks between employment and inflation now justifies a pause in rate cuts. He noted that, after the recent 75-bp reduction, the federal funds rate is “around neutral” or at the “higher range of the neutral range.” Powell also reiterated that the Fed does not mechanically target the natural rate (r*) but instead evaluates a broad set of indicators to assess whether policy is restrictive, neutral, or accommodative.
Since 2012, the Fed has increasingly emphasized its employment mandate. The 2012 “Statement on Longer-Run Goals and Monetary Policy Strategy” established a 2% inflation target. Revisions in August 2020 introduced Flexible Average Inflation Targeting (FAIT), allowing inflation moderately above 2% following periods of persistent undershooting, and shifted language from “deviations of employment” to “shortfalls of employment,” creating an asymmetric approach tolerant of low unemployment.
While these frameworks aimed to support economic growth, they also risked overstimulation, potentially reducing long-term growth and creating regressive distributional effects. Elevated inflation increases uncertainty for production and investment decisions, disproportionately affecting those with limited hedging options.
The August 2025 revision of the Fed’s strategy marked a return to a more balanced approach, removing explicit references to a persistently low neutral rate and the effective lower bound, and abandoning the emphasis on running the economy “hot” to achieve maximum employment. The Committee reaffirmed that maintaining price stability—anchored at 2% PCE inflation—is central to achieving both maximum employment and long-run economic stability.
Labor Market Dynamics and Structural Shifts
The labor market has experienced substantial deceleration over the past year, providing the primary rationale for recent monetary policy easing. Both demand-side and supply-side factors have contributed to the slowdown in employment growth. In 2025, nonfarm employment increased by 584,000, a significant slowdown from over 2 million jobs added in 2024. Federal employment declined by 274,000, largely due to initiatives from the Department of Government Efficiency, while manufacturing and retail trade also recorded net job losses.
Immigration policy enforcement has further contracted the labor force. Between March 2025 and December 2025, foreign-born employment declined by 1.113 million workers, who subsequently exited the labor market entirely. Concurrently, federal workforce reductions eliminated approximately 220,000 positions. Together, these factors substantially reduced the available labor pool, disproportionately affecting industries and occupations traditionally reliant on less-educated and immigrant workers.
Recent research highlights additional technology-driven disruptions. A Stanford University working paper documents that artificial intelligence adoption has produced asymmetric employment effects across demographic cohorts. Workers aged 22–25 in occupations with the highest AI exposure have experienced a 13% employment decline since 2022, indicating significant displacement concentrated among entry-level workers.
Irrespective of normative assessments of these structural developments, conventional monetary policy accommodation through interest rate cuts is unlikely to materially alter supply-side or technology-driven labor market outcomes. As argued in “What Should Be Done?” [10], prioritizing inflation control first is more effective: maintaining stable, low inflation will create conditions for an optimal labor market and sustainable maximum employment.
Lower Break-Even-Employment
Recent empirical research by Cheremukhin (2025) of the Federal Reserve Bank of Dallas [4] shows that U.S. break-even employment requirements have contracted significantly due to shifts in immigration patterns. Using high-frequency estimation techniques, Cheremukhin demonstrates that changes in immigration flows, combined with cyclical variations in labor force participation, have sharply reduced the monthly job creation threshold needed to maintain a stable unemployment rate. Specifically, the monthly break-even employment requirement fell from roughly 250,000 positions in 2023 to an estimated 30,000 by mid-2025.
The underlying theory of break-even employment holds that stabilizing the unemployment rate requires employment growth to match labor force growth. Translating this into absolute terms provides a measure of the net jobs required each month. Cheremukhin constructs high-frequency time series for three key components of U.S. population dynamics—natural population change, legal immigration flows, and net unauthorized immigration—and combines them to generate a comprehensive estimate of break-even employment dynamics.
These calculations show that the monthly job creation threshold required to maintain labor market equilibrium rose from under 100,000 positions in late 2020 to roughly 250,000 by mid-2023, before declining sharply to approximately 30,000 by mid-2025. This dramatic contraction in break-even employment has important implications for assessing labor market conditions and interpreting employment data in the current macroeconomic environment.
Assessment of Monetary Policy Stance
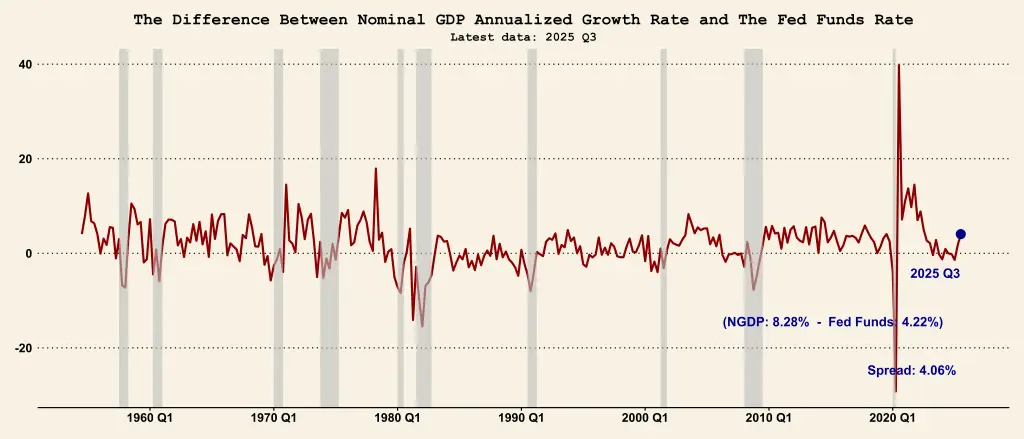
A common gauge for assessing the stance of monetary policy is the spread between the annualized growth rate of nominal GDP and the federal funds rate. This differential indicates whether policy is accommodative or restrictive. During the current business cycle, this spread has remained largely positive, with only a brief negative interval, in contrast to previous recessions, where persistently negative spreads typically preceded or coincided with economic contractions.
In the third quarter of 2025, nominal GDP growth reached 8.2% on an annualized basis, while the effective federal funds rate averaged 4.2%, resulting in a positive spread of 400 basis points. This sizable differential suggests that monetary conditions at the end of the third quarter were clearly accommodative. The persistence of a positive spread further supports the view that monetary policy was not excessively tight during this period.
Additional macroeconomic and financial indicators support this assessment. If monetary policy were excessively restrictive, we would expect to see slower nominal spending growth, weaker income expansion, declining corporate profitability, wider credit spreads, and falling inflation expectations. None of these signs are present: nominal income growth remains robust, corporate profit margins are stable, credit spreads are within normal ranges, and inflation expectations—both survey- and market-based—remain anchored near the Fed’s target.
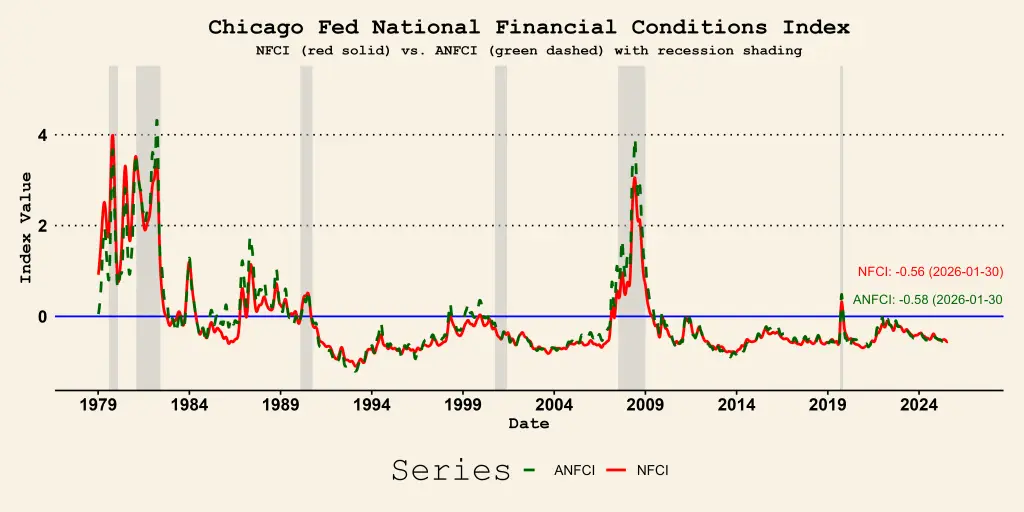
Financial conditions indices provide further insight. The Chicago Fed’s Adjusted National Financial Conditions Index (ANFCI), which synthesizes conditions across money, debt, equity, and broader financial markets, has consistently registered negative values throughout the Fed’s disinflation campaign, signaling accommodative financial conditions. Since 2023, the index has trended even more negative, reflecting progressively easier financial conditions despite elevated policy rates. This pattern reinforces the conclusion that the current tightening cycle has not created restrictive financial conditions.
Labor Market Conditions and the Sahm Rule
The United States unemployment rate declined to 4.4% in December 2025 from 4.5% in November, maintaining levels insufficient to activate the Sahm Rule recession indicator.[1] This empirical rule, developed by Claudia Sahm, identifies recessionary conditions when the three-month moving average of the unemployment rate increases by at least 0.50 percentage points relative to its minimum three-month average over the preceding 12-month period. As of December 2025, the Sahm indicator registered 0.33%, remaining below the recessionary threshold of 0.50%.
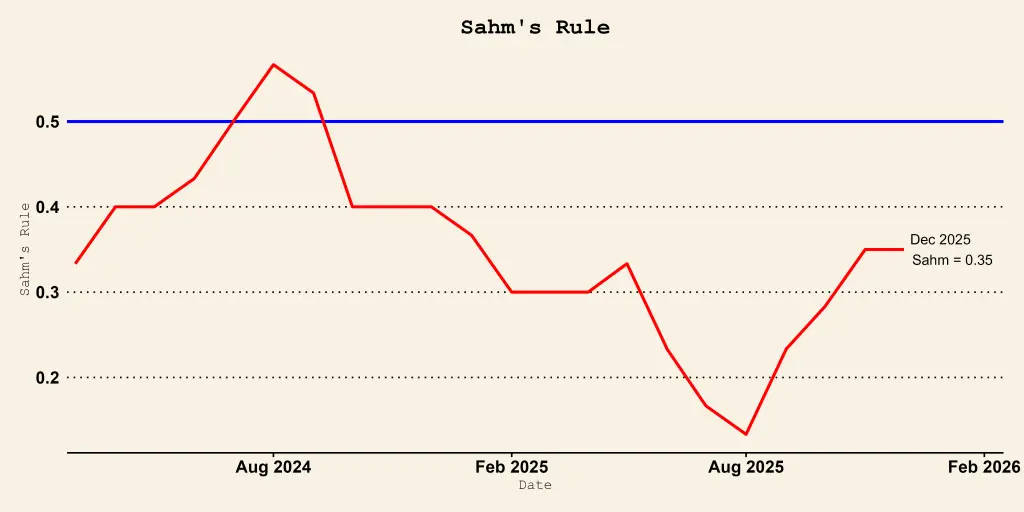
Historical evidence shows that unemployment rates exhibit persistent upward trajectories during recessionary episodes. While the Sahm Rule has demonstrated efficacy in identifying recession onset, it functions as a coincident rather than leading indicator, confirming rather than anticipating cyclical downturns. Furthermore, the suite of indicators monitored by the National Bureau of Economic Research (NBER) Business Cycle Dating Committee corroborates that the United States economy is not currently in recession.
Monetary Policy Assessment: The Taylor Rule Framework
The Taylor Rule, developed by economist John B. Taylor, provides a normative framework linking the Federal Reserve’s policy interest rate to key macroeconomic fundamentals—namely, inflation and the output gap—serving as a benchmark for assessing monetary policy stance.[1] The rule incorporates the output gap, estimated using Congressional Budget Office (CBO) measures of potential output, and contemporaneous inflation, measured via the GDP Implicit Price Deflator. The conventional specification assumes a 2% inflation target and a 2% equilibrium real interest rate (r*), though these parameters can be adjusted based on evolving economic conditions and central bank objectives.
In our estimated model, we set the equilibrium real rate at 1.0%, consistent with recent Laubach-Williams estimates, and the Fed’s 2% inflation target. Under this configuration, the Taylor Rule prescribes a federal funds rate of 5.45%, compared to the observed rate of 4.33% in the third quarter of 2025. Following subsequent Fed rate cuts, the policy rate stood at 3.62% in January 2026. In this model, changes in r* translate approximately one-for-one into adjustments of the Taylor rate.
The analysis indicates a substantial gap between the model’s recommended rate and the observed policy rate. With the current policy rate, after 75 basis points of recent cuts, positioned well below the Taylor Rule recommendation, there is limited justification for further immediate monetary accommodation. The Fed’s pause at the January 27–28 meeting, maintaining the target range at 3.50–3.75%, may reflect a continuation of gradual policy normalization, albeit at a slower pace.
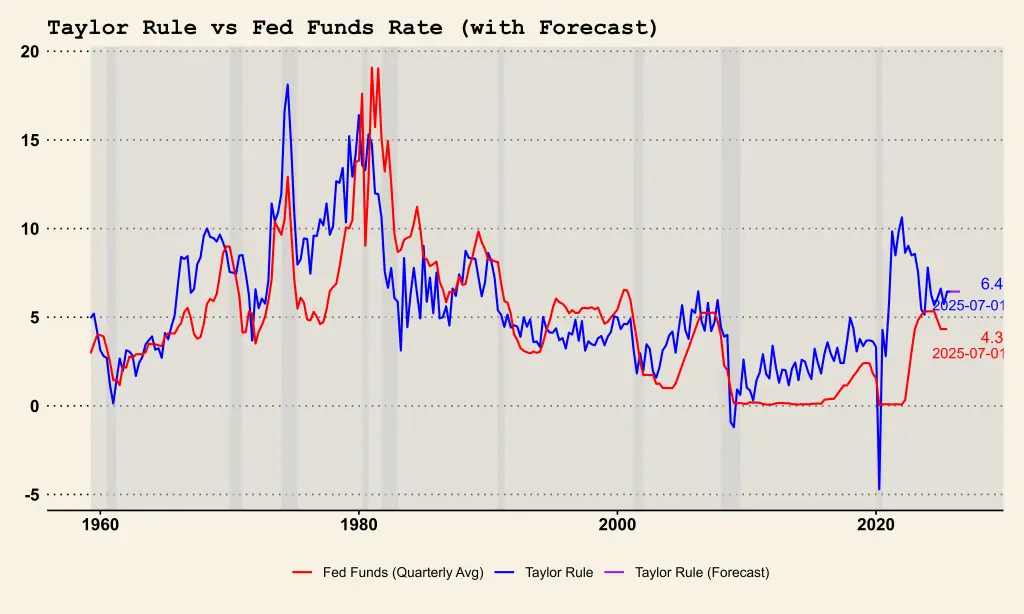
Under the Taylor Rule framework, the prescribed policy response is to raise interest rates when inflation accelerates and to reduce rates when economic growth slows. When both conditions occur simultaneously—as often happens during adverse supply shocks—the optimal prescription may be to maintain the policy rate at its current level. However, if labor market conditions weaken and unemployment begins to rise, political and market pressures can increase the likelihood of monetary accommodation, potentially influencing the Fed’s decisions beyond the rule’s mechanical guidance. Fed Chairman Jerome Powell has suggested that the Fed should focus on the relative deviations from its dual objectives of price stability and maximum employment.
Between 2015 and 2025, U.S. monetary policy experienced one of its most dynamic cycles in decades. The Fed gradually raised the federal funds rate to 2.25%–2.50% by 2018, before reversing course in 2019 with three “insurance” cuts to 1.50%–1.75%. In response to the COVID-19 pandemic, rates were sharply reduced to 0%–0.25% and maintained through early 2022 despite falling unemployment and rising inflation. From March 2022 to July 2023, the Fed executed its fastest tightening campaign in recent history, raising rates to 5.25%–5.50%. The policy stance shifted again in late 2024, with successive rate cuts bringing the target range to 3.50%–3.75% by the end of 2025. Viewed through the lens of the Taylor Rule, this decade reflects a persistently accommodative posture, with policy rates generally remaining below the levels implied by the rule since the Great Recession.
The US Economy is Expanding
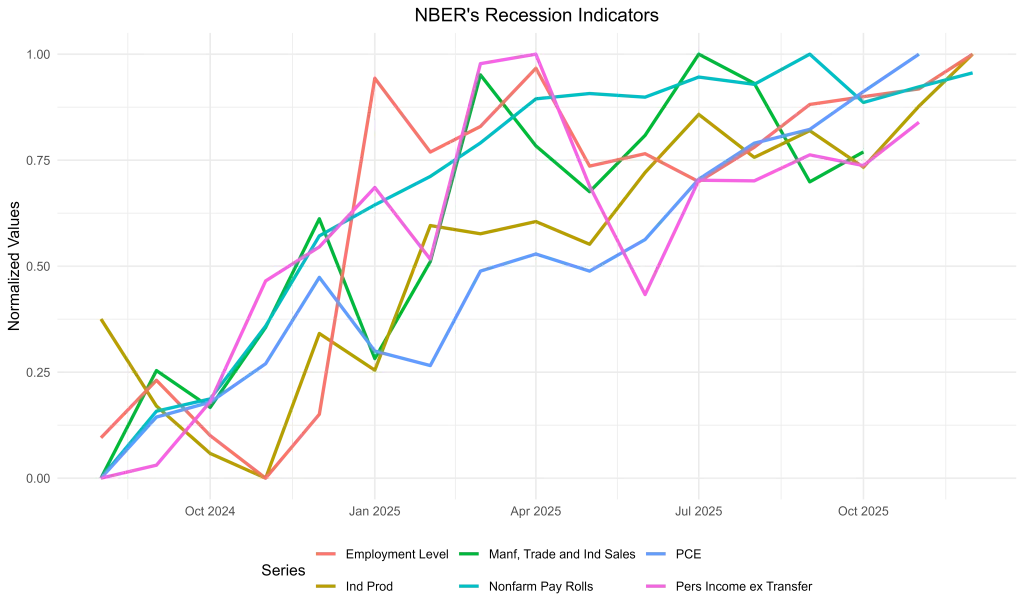
The National Bureau of Economic Research (NBER) Business Cycle Dating Committee establishes the authoritative chronology of U.S. business cycles. The Committee defines a recession as “a significant decline in economic activity that is spread across the economy and lasts more than a few months.”[2] In formulating its determinations, the Committee conducts a comprehensive evaluation of monthly economic indicators, including real personal income less transfer payments, nonfarm payroll and household employment, real personal consumption expenditures, inflation-adjusted wholesale and retail trade sales, and industrial production.
Recent readings across these series continue to demonstrate economic resilience, although the majority of indicators have exhibited stabilization rather than growth. Personal consumption expenditures (PCE) have maintained robust performance, while industrial production (IP) has shown recent growth momentum. The remaining indicators have stabilized without contraction, and critically, none display broad-based decline. Consequently, the observed deceleration is limited in scope and does not satisfy the Committee’s criteria for declaring recessionary conditions.
The Committee also considers quarterly national income and product account aggregates, most notably Gross Domestic Product (GDP) and Gross Domestic Income (GDI). In the third quarter of 2025, real GDP expanded at a 4.4 percent seasonally adjusted annual rate (SAAR), with year-over-year growth of 2.3 percent. Real GDI advanced at a 2.4 percent SAAR in the second quarter of 2025, a modest deceleration from 2.6 percent in the preceding quarter, while year-over-year growth reached 2.4 percent. Although official fourth-quarter estimates remain forthcoming, the Federal Reserve Bank of Atlanta’s GDPNow nowcasting model currently projects fourth-quarter real GDP growth at 4.2 percent SAAR, suggesting further acceleration. This projection, however, may incorporate upward bias due to exceptionally strong net export performance in the early portion of the quarter.
Taken together, the available empirical evidence indicates no substantial or broad-based economic deterioration. Aggregate data continue to reflect ongoing expansion and provide no analytical foundation for the Committee to designate the onset of a recessionary episode. To justify such a determination, economic weakness would need to be both pervasive across key
